Prometheus Metric Types
![]()
Prometheus has a few metric types, which are;
Gauge: Fluctuating single numerical value that can go up and down.
Histogram: A distribution view of bucketed observations.
Summary: Calculated quantiles over a sliding time window.
Counter: A cumulative count that only increases.
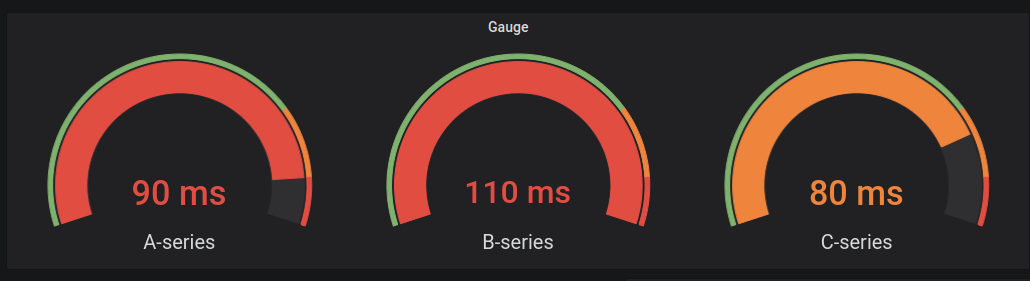
Gauge Metric
Gauges are similar to counters but can increase or decrease arbitrarily. They represent a snapshot value at a specific point in time. Typically, they are used to measure metrics that can fluctuate, such as CPU/memory usage, number of concurrent connections, temperature readings, and more.
Characteristics of Gauges
- Dynamic Values: Gauges can go up and down. This makes them suitable for metrics that vary over time.
- Instantaneous Measurement: Gauges capture the current value at the time of collection, providing an instantaneous view of the metric.
- Use Cases: Common use cases for gauges include monitoring resource usage (CPU, memory), active sessions, queue lengths, and other metrics that can both increase and decrease.
Example Usage
Here is an example of how you might define and use a Gauge in a Prometheus-compatible application:
// Define a Gauge
var cpuUsage = prometheus.NewGauge(prometheus.GaugeOpts{
    Name: "cpu_usage",
    Help: "Current CPU usage",
})

// Register the Gauge with Prometheus
prometheus.MustRegister(cpuUsage)

// Set the Gauge value
cpuUsage.Set(23.5) // setting the current CPU usage to 23.5%
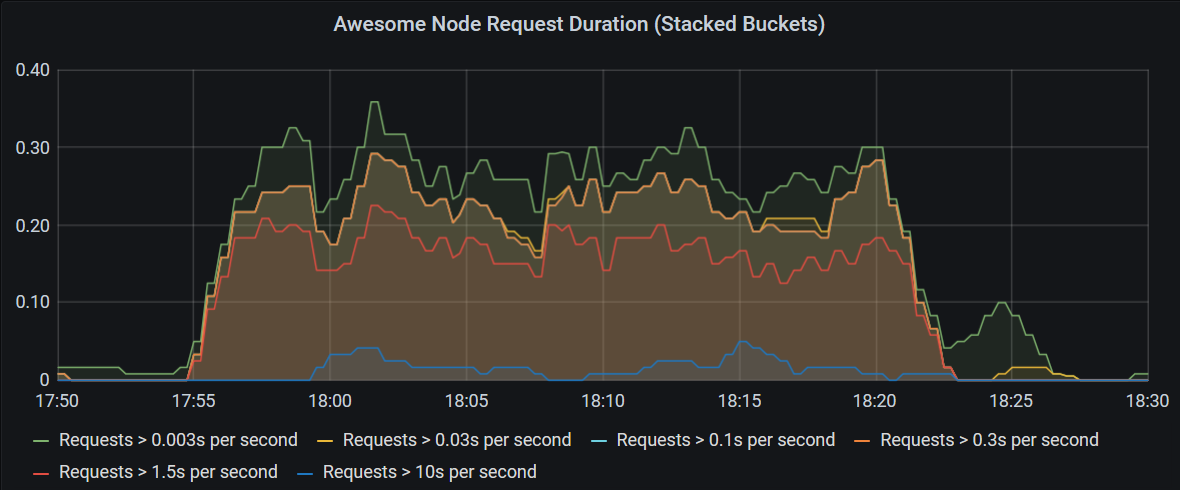
Histogram Metric
Histograms track the distribution of events over time. They are useful for measuring the statistical distribution of values, such as request durations or response sizes.
Characteristics of Histograms
- Bucketed Observations: Histograms work by categorizing observations into predefined buckets. Each bucket counts the number of observations that fall into a specific range.
- Cumulative Counts: Prometheus histograms maintain cumulative counts for each bucket, making it possible to derive the count of observations that fall into any specific range by subtracting the counts of adjacent buckets.
- Sum of Observations: Histograms also track the sum of all observed values, allowing you to calculate the average of the observations.
Example Usage
Here is an example of how you might define and use a Histogram in a Prometheus-compatible application:
// Define a Histogram
var requestDuration = prometheus.NewHistogram(prometheus.HistogramOpts{
    Name:    "node_request_duration_seconds",
    Help:    "A histogram of the node request duration.",
    Buckets: prometheus.DefBuckets, // Default buckets provided by Prometheus
})

// Register the Histogram with Prometheus
prometheus.MustRegister(requestDuration)

// Observe a value
requestDuration.Observe(1.2) // observing a request duration of 1.2 seconds
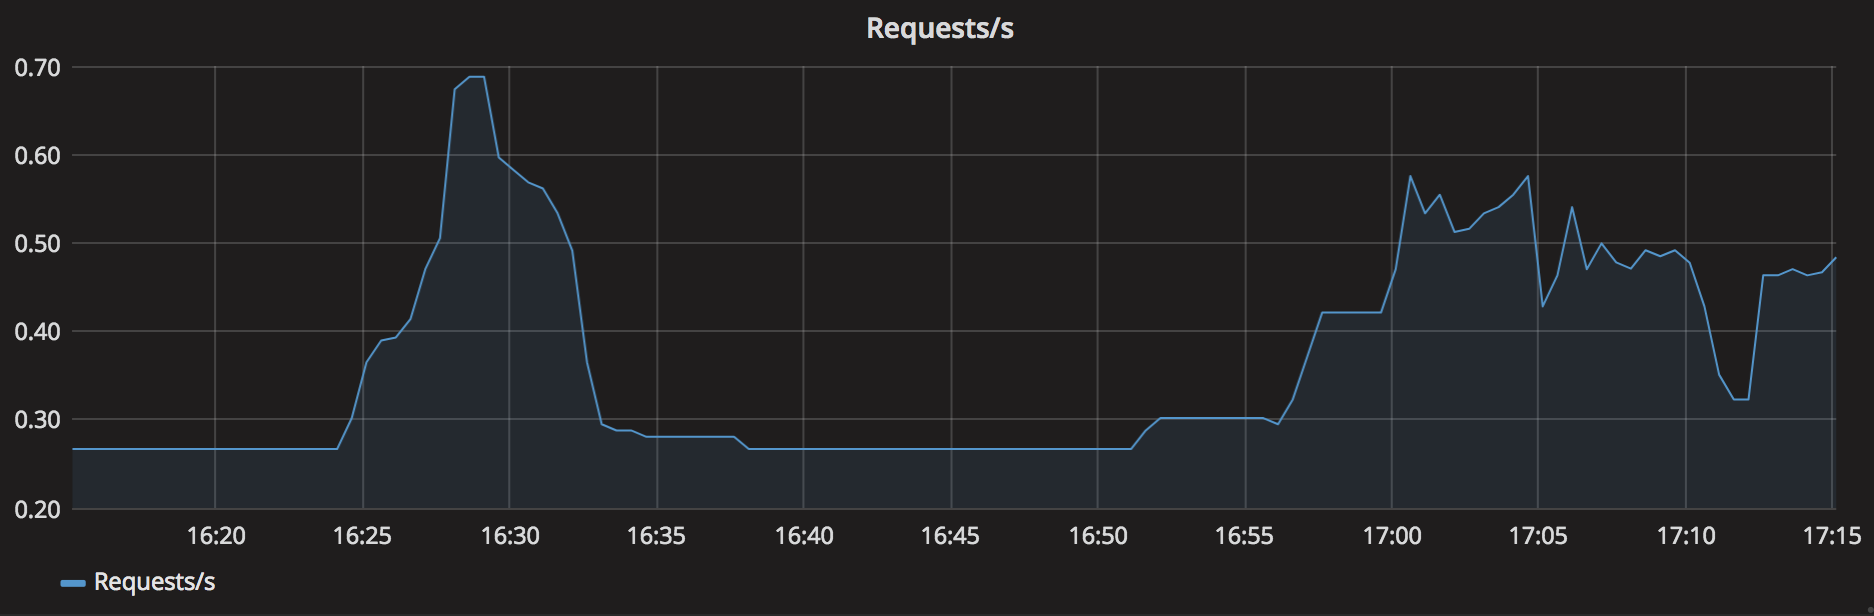
Summary Metric
Summaries are similar to histograms but also provide a total count and sum of observed values. They are useful for monitoring request latencies and other distributions where quantile estimation is needed.
Characteristics of Summaries
- Quantile Calculation: Summaries calculate configurable quantiles (e.g., 0.5, 0.9, 0.99) over a sliding time window, which makes them useful for latency measurements and other performance metrics.
- Total Count and Sum: Summaries maintain a total count of observations and the sum of all observed values, allowing you to calculate the average of the observations.
- Sliding Window: The quantiles are calculated over a configurable sliding time window, which helps in getting recent statistics without considering outdated data.
Example Usage
Here is an example of how you might define and use a Summary in a Prometheus-compatible application:
// Define a Summary
var requestLatency = prometheus.NewSummary(prometheus.SummaryOpts{
    Name:       "http_request_latency_seconds",
    Help:       "A summary of the request latency.",
    Objectives: map[float64]float64{0.5: 0.05, 0.9: 0.01, 0.99: 0.001},
})

// Register the Summary with Prometheus
prometheus.MustRegister(requestLatency)

// Observe a value
requestLatency.Observe(1.2) // observing a request latency of 1.2 seconds
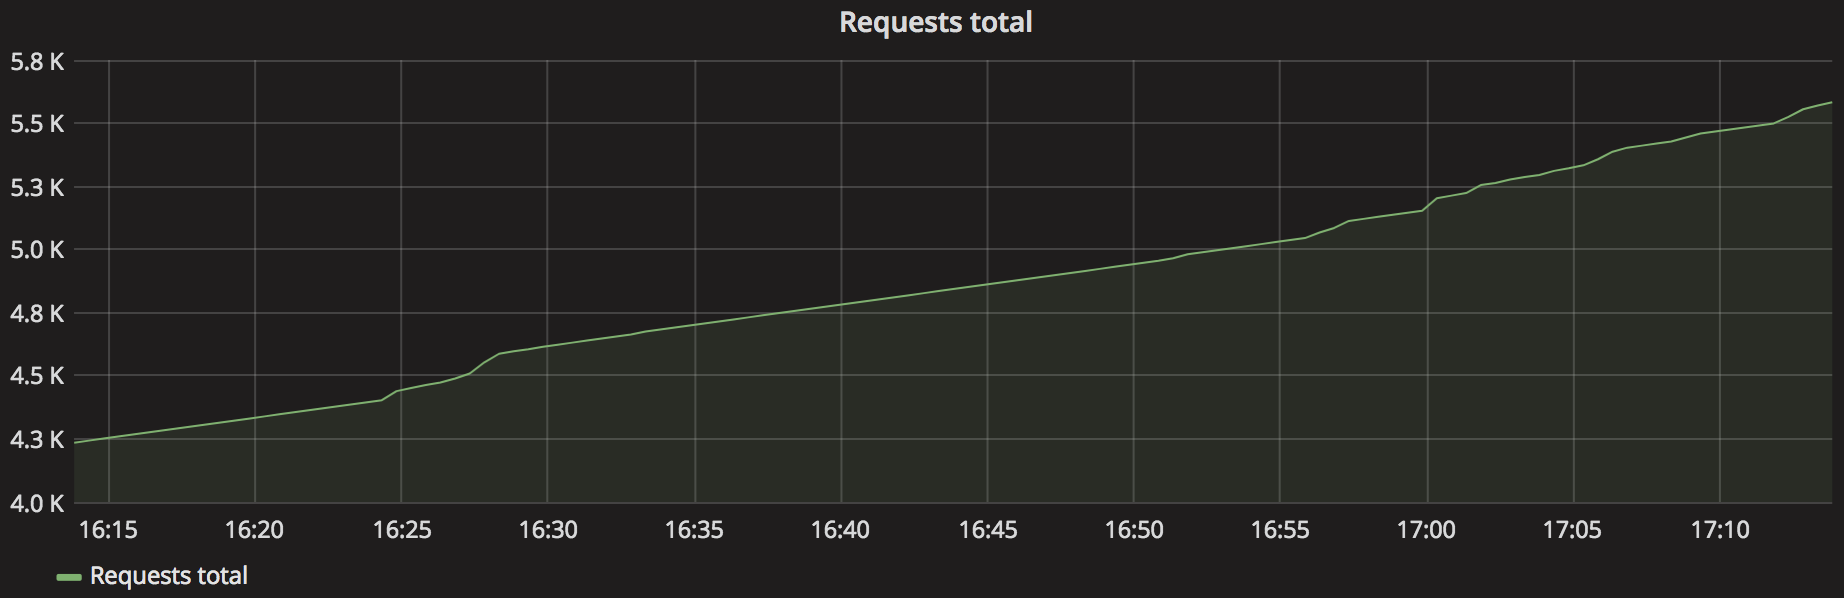
Counter Metric
Counters represent a cumulative value that only increases over time. It resets to zero on process restart. Typically, they are used to track the number of occurrences of an event, number of requests, errors, or completed tasks.
Characteristics of Counters
- Monotonic Increase: Counters only increase; they are never decremented. This makes them ideal for counting events.
- Reset on Restart: When the process restarts, the counter value resets to zero. Prometheus handles these resets gracefully, ensuring that the increase is tracked correctly over time.
- Event Tracking: Counters are used to measure the number of events, such as HTTP requests, errors, and task completions.
Example Usage
Here is an example of how you might define and use a Counter in a Prometheus-compatible application:
// Define a Counter
var requestCount = prometheus.NewCounter(prometheus.CounterOpts{
    Name: "http_requests_total",
    Help: "A counter for the number of HTTP requests received.",
})

// Register the Counter with Prometheus
prometheus.MustRegister(requestCount)

// Increment the Counter
requestCount.Inc() // increments the counter by 1
requestCount.Add(5) // increments the counter by 5